

How do you find analytics for a single page in GA4? It’s not easy. Turns out, GA4 is difficult to navigate. If you’re seeking out the information in this blog post, you probably agree.
In this post we’ll present four methods for finding an individual page in GA4:
- Pages and Screens report [6 steps]
- Custom report [14 steps]
- Exploration [8 steps]
- The ércule app [1 step]
We’ll walk through each one step-by-step with screenshots for you to follow along. The first three methods are implemented within the GA4 dashboard. The fourth method is through the ércule app, which automatically ingests your GA4 data and provides a much simpler, user-friendly dashboard. Let’s get steppin’.
1. Using the default “Pages and Screens” report [6 steps]
Advantages of this approach: It’s the simplest and quickest of the methods in GA4.
Disadvantages of this approach: You have to repeat these steps every time. It can be hard to filter for your exact page. If you’re looking for a “/blog” page, for example, it can be difficult if you have a very large blog.
The simplest way of getting here with the default reports in GA4 is to go to Reports > Lifecycle > Engagement > Pages and screens.
From here you should see a list of pages, but by default it’s sorted by page title. This isn’t always helpful—especially if you have lots of repeat titles.
You can pick either page path plus query string, or if you want easier, rolled-up page performance, you can do page path and screen class.
Then type the page path you care about.
It will filter the listed pages (such as “/blog”).
Adding a conditional filter for page path
Alternatively, from within the same report, you'll see a filter bar at the top. Click the add filter button.
The advantage of this approach: It gives you a little more control than the default report because you’re able to filter for more parameters.
Now you’ll see a sidebar that lets you filter by lots of different properties. Pick “Page path and screen class” again – but now you have more options for matching the page path.
If you pick “contains” you can find any URL containing “/blog” for example. If you pick “exact” you can filter for just “/blog”.
If you are comfortable with regex you can include or exclude page paths containing different values. (You can also ask AI to build you these!)
And you’re done.
2. Setting up a custom report [14 steps]
The next option is building a custom report.
The advantage of this approach: You can build a meaningful report and it will persist, which is really nice.
The disadvantage: The process is longer and a bit more tedious.
First off, go to Reports > Library > Create new Report
In this example, we’ll start with “Blank” so it's really obvious how you do everything.
First we’ll add dimensions. Dimensions include data fields like dates, page paths, channels, etc.
For this instance, we'll choose “Page path” and then hit “Apply.”
To recreate the same report as the one above, add a metric and choose “Views”. Things like bounce rate, users, sessions, views—those are metrics.
We can customize this view using the build filter.
We want to filter this report so that it shows pages containing a particular word or phrase.
The process here is the exact same as building a filter from the previous option. Select “Contains” for the Match Type and select the phrase that you want to filter for. (In this instance, the phrase we’ve chosen is “google analytics”.
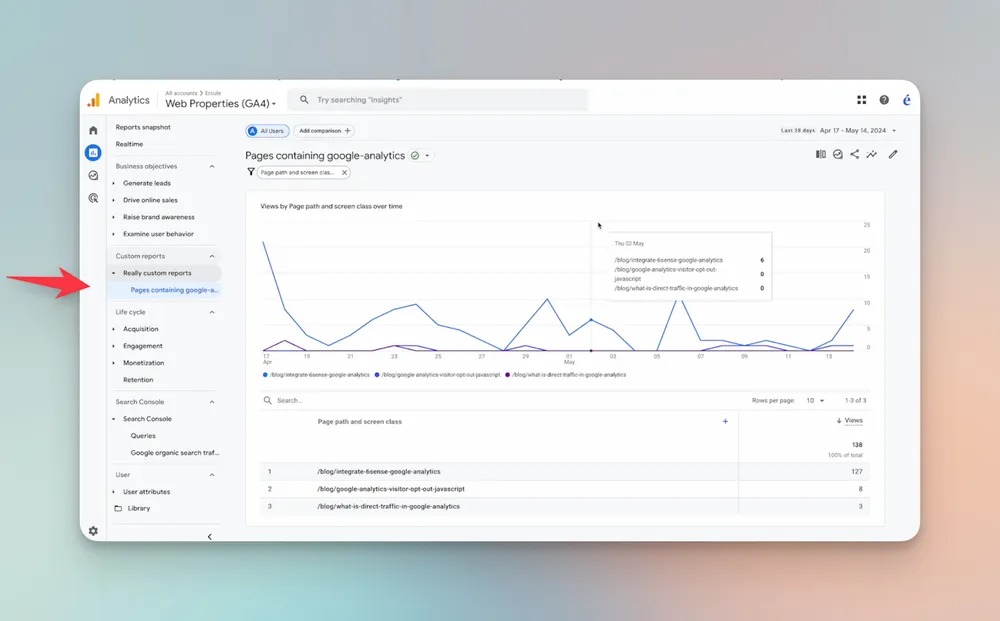
After saving your filter, you save your report and give it a name. In this example, we’ll name it “Pages containing google-analytics.”
Now we'll go back and see that it's always available right in the library.
Adding your custom report to the sidebar
You can also add it to your sidebar by creating a collection. We'll make a new one here.
Pick a “Blank” collection.
Name it whatever you want. In this example, we’ll simply name it “Custom reports.”
Now search for the report you named earlier. Drag over the report that you named earlier.
Then save it.
Now go back to the library screen and publish the collection.
It’s published! And it persists. So you can find it any time in the Custom reports tab.
3. Exploration [8 steps]
Exploration is the most granular way to break down metrics for a single page.
The advantage of this approach: you can access and export a wider variety of data.
The disadvantage: In most cases it might be more data – and more complicated – than you really need to see for a single page.
To get started, go to “Explore” in the sidebar. Click “Blank” to start a new blank exploration.
Select “Free form” visualization. Free form is the most customizable option for a visualization.
Pick a date range that you want to view.
Then within the Dimensions field, type the word “page” into the search bar and select “Page path and screen class” (like we've done before). Once it’s selected, click “Import”.
Then in metrics, we'll import “Views”.
Now drag the “Page path and screen class” dimension from the “Variables” column on the left to the “Rows” section in the “Settings” column.
Do the same with the “Views” metric. Drag it from the left – drag it from the “Variables” column on the left to the “Values” section in the “Settings” column.
You can see how this becomes a pretty intense way of consuming data.
This example we’ve created here is one of the most simple explorations you can create. It’s showing a roll-up of performance across the last 12 months.
4. The ércule app [4 steps]
The ércule app is a content strategy and analytics app that integrates your Google Analytics and Google Search Console data into consumable and actionable analytics for every page on your site.. We created the ércule app after seeing countless marketers get frustrated with the GA4 interface. (We get it. We need this, too.)
Rather than burying you in data fields like GA4, the ércule app surfaces the metrics that matter to your content growth. It enables you to search for individual pages and segment pages into collections based on flexible filtering, so you can track performance of your library across initiatives over time.
Sign in to the ércule app using a Google account that has access to your website’s GA and GSC data. Then fill out these fields in order to set up your first library.
After you click “Create” it will take a few minutes to process and integrate the GA and GSC data.
Once your account is all set up, finding an individual page takes just two clicks.
First, click on the “Library” tab.
You can find any page by typing in words or phrases from the page’s title or URL into the search bar. In the example below, we’re looking for the pages on our site that have Google Analytics in the title.
Click on the desired page to get an individual performance report.
As noted, the ércule app surfaces only the data that marketers actually need to assess the performance of a page in organic search. This includes traffic, growth rate, bounce rate, and top-performing search queries.
It will also link you directly to the page’s filtered data in the GA4 interface. Just click the “Google Analytics” button.
The “Google Analytics” button brings you directly to a “Pages and screens” report for that individual page.
It’s that simple. You can find any page and its GA4 data in a matter of seconds.
Next steps
Finding the data you need is the first big hurdle. The next question is: how can you use that data to improve performance and conversion for the individual page and the library on the whole?
- If search and engagement metrics are disappointing, you might implement an on-page update.
- If engagement and conversion metrics are strong, distribute it widely on your targeted social platforms.
- If branded search queries are driving traffic to the page, consider optimizing for strategic branded queries.
- If overall traffic is in decline, identify the causes and revise the page to start growing again.
And if you’re puzzled by any of the data you find, feel free to drop us a line anytime!
